
Abstract
Social mixing patterns are crucial in driving transmission of infectious diseases and informing public health interventions to contain their spread. Age-specific social mixing is often inferred from surveys of self-recorded contacts which by design often have a very limited number of participants. In addition, such surveys are rare, so public health interventions are often evaluated by considering only one such study. Here we report detailed population contact patterns for United Kingdom based self-reported contact data from over 36,000 volunteers that participated in the massive citizen science project BBC Pandemic. The amount of data collected allows us generate fine-scale age-specific population contact matrices by context (home, work, school, other) and type (conversational or physical) of contact that took place. These matrices are highly relevant for informing prevention and control of new outbreaks, and evaluating strategies that reduce the amount of mixing in the population (such as school closures, social distancing, or working from home). In addition, they finally provide the possibility to use multiple sources of social mixing data to evaluate the uncertainty that stems from social mixing when designing public health interventions.
1 Introduction
For directly transmitted respiratory pathogens such as influenza, measles and coronaviruses, social mixing patterns shape the risk of individual-level infection [6] and population-level transmission dynamics [27, 17], as well as the effectiveness of control measures targeted at specific age groups [2]. Typically two main approaches have been used to measure social mixing patterns relevant for the spread of disease: inference of contacts based on wearable devices such as proximity sensors [24, 19], or self-recording of contacts [9]. As well as being able to capture age-specific patterns of infection [17], self-recording also allow for details of the type and setting of social contacts, and demographic information about the contacts themselves.
A landmark dataset of self-reported contacts was the POLYMOD study [21], which collected social mixing data for 7,290 participants across eight European countries. These data have been widely used to understand the epidemiology of infectious diseases [23] and inform policy-relevant disease modelling [22, 2]. However, the sample size for each country (e.g. 1,012 participants for Great Britain) limit the ability to stratify by multiple demographic factors and still obtain precise estimates of social mixing within those groups, and does not have details about the location of participants, which meant social contacts could not be compared between spatial covariates such as urban and rural setting. Moreover, the POLYMOD was conducted in 2005-6, and so patterns may have changed since then.
To generate a more contemporary large-scale dataset on social mixing and movement patterns in the United Kingdom, the BBC Pandemic project recruited over 86,000 participants between September 2017 and December 2018 as part of a public science project linked to a BBC4 documentary [16]. Here we present high resolution age-specific social mixing matrices based on data from over 40,000 participants, stratified by key characteristics such as contact type and setting.
2 Data collection
There were two components to the BBC Pandemic study, one focused on the town of Haslemere [15], and another focused on wider UK population [16]. Here we focus on the UK national study. Upon downloading the BBC Pandemic app for this study, users first entered their basic demographic information, including age, household size, gender and occupation. The app then recorded their approximate location at hourly intervals for a 24 hour period. At the end of this period, users recorded each social contact they had made during this period, including information on: the contact’s age; the type of interaction (conversational contact, defined as face-to-face conversation of three or more words, or physical contact); the setting of the contact (home, work, school, other); and whether the participant had spoken to that person before.
Overall, over 86,000 participants started the survey and filled out their profile. Participants with no encounter or location data were excluded, as were users whose location recordings were all outside the UK. This leaves a rich dataset of around 55,000 participants. Of those, 40,177 completed the study and reported their social contacts at the end of the survey – this is the focus for this paper.
The data collection process had some limitations. In particular, the initial version of the app had the default age of a contact as 50-years-old. Participants were free to change the value on slider, but if they just clicked through, it would record that contact’s age as 50. As a result, the early data had more contacts of this age than was plausible. In our analysis, we therefore remove users with 3 or more contacts of the age exactly 50 (4,007 users dropped). These users together reported 101,880 contacts out of which 24,171 were aged exactly 50-years-old. Second, the initial version did not allow users to record precisely zero contacts: these users may thus be missing from our denominators, we do not expect this effect to be large and for simplicity have not attempted to correct for it here.
2.1 Ethical considerations
Information was provided and consent obtained from all participants in the study before the app recorded any data. The study was approved by London School of Hygiene & Tropical Medicine Observational Research Ethics Committee (ref 14400).
3 Methods
We follow [27] to infer mixing matrices from the self-reported contact data. We group the study participants and their contacts by age into following age groups: 0-4, 5-9, 10-12, 13-14, 15-17, 18-19, 20-21, 22-24, then 5 year age bands from 25 to 74, and a single category for those aged 75 and over: the finer structure chosen to add offer higher resolution at school and university ages. For each of those age groups, we find tij: the total number of reported contacts over the course of 24 hours between participants in age group j and their reported contacts of estimated age group i. To find the mij: the mean number of contacts who are age group i as reported by participants in age group j we divide tij by nj – the total number of participants in age group j.
This results in the ‘social contact matrix’ M = (mij), where mij = tij/nj. This is the raw contact matrix that follows from study data.
We can deduce more from our reported contacts as the contacts are reciprocal (if person A was in contact with B, that means that the person B was also in contact with person A). On a population level that means that the total number of contacts from age group j to i, must be equal to the total number of contact from age group i to age group j. As the sample of participants might have a different population structure than the wider population, this step uses country-specific population structure: wi is the total population size of the age group i. In our case, volunteers needed to be in the UK to participate in this massive citizen science project, so we use the 2018 mid-year estimate of the population structure of the UK (available from ONS [1]). The reciprocal matrix C = (cij) gives the population contact matrix, where 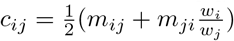 [27].
[27].
The population matrix C is of particular importance for infectious disease dynamics because it is related to the next generation matrix [7, 25]. The next generation matrix N captures how the infection spreads when pathogen is first introduced in a population, and its (i, j) entry gives the expected number of new infections in compartment i produced by in infected individual originally introduced to compartment j. As a result, the dominant eigenvalue of N is equal to the basic reproduction number R0 or the expected number of secondary infections caused by a single individual introduced to a completely susceptible population. The relationship between the two matrices is 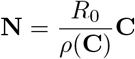 where ρ(C) is the dominant eigenvalue of C (its spectral radius). Analogous to the eigenvector representing stage-specific contributions to overall population reproduction in demographic theory [3], the dominant eigenvector here gives an indication of which age-groups most contribute to transmission in the population, assuming no age-specific differences susceptibility or infectiousness (Fig 2).

(A) Age distribution of participants included in this study, (B) distribution of ages of contacts, (C) distribution of the number of contacts per participant with its MLE-fit of log-binomial distribution indicated in blue (size = 2.289, µ = 7.215), (D) population structure of the study population compared to UK mid-year estimate for 2018 (ONS data [1]).

(A) Population contact matrix capturing all conversational contacts, (B) population contact matrix inferred from all physical contacts in the study, with white indicating missing values, (C) dominant eigenvectors of the symmetric subset of the two matrices without missing values.
We did these same calculations stratified by type of contact (physical or conversational) and by context (home, work, school, other), resulting in 8 matrices each for the raw contact matrix shown in Fig S1 and population contact matrix in Fig 3.

Raw contact matrices. Mean number of contacts reported by participants of given age groups, M, before accounting for reciprocity of contacts. Matrices are by different encounter type (conversational or physical, in respective columns) and by different encounter context (home, work, school or other in respective rows). A) conversational home, B) physical home, C) conversational work, D) physical work, E) conversational school, F) physical school, G) conversational other, H) physical other.

Population contact matrices. Mean number of contacts reported by participants of given age groups adjusted for reciprocal number of contacts, C, assuming population age structure given by the 2018 mid-year estimate from ONS [1]. Matrices are by different encounter type (conversational or physical, in respective columns) and by different encounter context (home, work, school or other in respective rows). (A) conversational home, (B) physical home, (C) conversational work, (D) physical work, (E) conversational school, (F) physical school, (G) conversational other, (H) physical other.
4 Results
The dataset used in this study consisted of 36,155 participants reporting 378,559 contacts. For ethical reasons, participants in the BBC study had to be at least 13 years of age, although we saw a gradual decline in the number of younger participants rather than a hard cutoff at this age (Fig 1A). Total reported contacts (i.e. the sum of physical and conversational contacts) were distributed across a wide range of age groups, with a peak reflecting the peak in age of participants, and spikes likely representing bias to chose round numbers as estimated ages of casual contacts. The distribution of number of contacts reported across all participants followed a log-binomial distribution with mean 7.2 (Fig 1C), and the participant population in the study under-sampled the youngest and oldest groups relative the underlying UK population (Fig 1D).
The total conversational and physical contacts varied greatly across the population (Fig 2A,B). On average, participants reported over four times more conversational contacts than physical contacts, and contacts that spanned a larger age range. The very strong diagonal density of contacts in the physical contact matrix (Fig 2B) is characteristic of strong age-assoritative mixing, and the sub-diagonal density captures interactions between children and their parents. The dominant eigenvectors of the matrices, which indicate the age groups that would drive transmission during the exponential phase of an epidemic simulated using these data, are highest for the 18-21 age group for both conversational and physical data (Fig 2C). However, the relative dominance of this age group is larger for conversational contacts compared to physical contacts.
The measured age-specific social mixing matrices also varied considerably between different types and settings. Reported contacts at home in the population contact matrix followed a strong age-assortative pattern (strong diagonal band), with inter-generational mixing shown by the off-diagonal bands in contacts (Fig 3A-B), which is especially pronounced in physical contacts at home. Conversational contacts at work showed less age-assortativity than contact at home (Fig 3C), and were around ten-fold more common than physical contacts at work, which showed a similar lack of assortativity (Fig 3D). Within school-aged groups, more conversational and physical contacts were reported on average at school than in other settings (Fig 3E-F), but for a very narrow age-band. Conversational contacts in other settings (i.e. not home, work or school) were age assortative for younger groups, but less assortative for older groups, with an off diagonal peak in contact intensity between older participants and other adults (Fig 3G). Physical contacts in other settings were less common, but also exhibited the transition from age-assortativity to less structured mixing in older age groups (Fig 3G).
5 Discussion
The BBC Pandemic study has the potential to provide extremely detailed insights into patterns of movements and social mixing in the UK, which will be valuable for understanding the dynamics of circulating infectious diseases as well as informing the prevention and control of new outbreaks. Analysis of the full study dataset is ongoing to ensure that information relevant for epidemiological research can be made widely available, while also protecting participant privacy and anonymity. However, the emergence of the novel coronavirus disease COVID-19 [14] has created an urgent need for the best possible social mixing data to be made available to support the outbreak response, as well as for the possibility to use multiple sources of social mixing data to evaluate the uncertainty that stems from social mixing in evaluating public health interventions. It is therefore our hope that this detailed contemporary picture of age-specific mixing patterns will be of value to those modelling COVID-19 to provide an evidence base for decisions on potential control measures in the UK, as well as suggesting broader insights into social mixing that may be relevant to other countries as well.
The matrices we present can be directly incorporated into mathematical models of transmission to predict the dynamics of infection with and between key demographic groups and settings [17, 22, 2, 16]. The large scale nature of the BBC data presented, with over 36,000 users and over 378,000 contacts, made it possible to generate fine-scale age-specific social contact matrices across different contexts. There were some notable differences between these matrices and those presented in the POLYMOD study, which surveyed 1,012 people in Great Britain. In particular, the mean number of conversational contacts reported by participants in the BBC study was much higher than POLYMOD (in [16] we estimate this factor to be about 5); this may have been influenced by the design of POLYMOD, in which contacts were right censored at 29. Moreover, POLYMOD by design oversampled children, whereas the BBC data oversampled adults, and hence may have captured more of the tail of the contact distribution in older age groups.
Incorporating social mixing patterns in different contexts into mathematical models, it is possible to evaluate the potential effectiveness of a range of control measures targeting respiratory infections, including school closures [4, 13] and social distancing [11]. However, the precise combination of setting and type of contact that will be important for transmission will depend on the infection being considered. There is evidence that both physical contacts [17, 6] and conversational contacts [8] may be relevant for capturing the transmission dynamics of acute respiratory infections such as Streptococcus pneumoniae and influenza A/H1N1p, and for influenza, there can be substantial transmission in households [10] and schools [20, 5]. How to weight the respective contributions of conversational and physical contacts to overall population transmission will depend on the pathogen.
There are some additional limitations to the dataset presented here. First, children under the age of 13 were excluded for ethical reasons, which meant there was a gap in the matrices for participants in this group. Given the role of school-age children in transmission of many respiratory infections, we are missing important information on mixing in school-aged children. For a flu-like pathogen, this group will be largely be responsible for transmission in the wider population [2] which can be seen from indirect effects observed in other age-groups by targeting the vaccination of children [12]. In our previous work [16] we fill the missing square (the dimensions of it will depend on the size of the age-groups chosen in the model) after making contacts reciprocal with appropriate values from POLYMOD. The missing data could also be interpolated from surrounding regions and assuming the log-binomial distribution of contacts.
There are other possible biases as well - the day that the participants took part was not randomly assigned. Instead, the participants could choose themselves when to run the app which might have biased some to choose a particularly ‘interesting’ day when they are going to meet a lot of people, or travel somewhere unusual. In addition, the participants themselves were not sampled at random from the population but instead chose to take part. How they heard about the study might might have varied from whether they were reached through social media in the drive to recruit participants before broadcast, or consequent to watching the BBC4 programme, or through hearing about it from friends – all of which could lead to selection bias. Given the big social media exposure around the citizen science project, our participants were recruited largely in two time periods: in October 2017 after the launch of the app, and in March 2018 after the airing of the documentary ‘Contagion! The BBC4 Pandemic’, but the uneven recruitment of participants over time should not have much impact. There is evidence, at least among school-aged children, that social contact structure during term-time is relatively consistent over a period of several months [18]. Contacts can also change between term-time and school-holidays [8] and with the health status of participants; individuals typically make fewer social contacts when they have ILI compared to a normal day [26]]. It may therefore be necessary to combine the matrices presented here with other datasets to fully explore transmission dynamics over long periods and account for changes in behaviour according to health status.
Data Availability
Data in this manuscript is available in the form of contact matrices in XLS files.
6 Acknowledgements
AJK was supported by a Sir Henry Dale Fellowship jointly funded by the Wellcome Trust and the Royal Society (grant Number 206250/Z/17/Z). We would like to thank 360 Production, and in particular Danielle Peck and Cressida Kinnear, for helping to make the collection of this dataset possible, and all our study participants for giving up their time to contribute to this public science project. We are grateful to Anne Alexander and Hugo Leal for helpful discussions regarding the ethics considerations and data privacy.
References


