
Abstract
The prognosis prediction of cancer patients is important for disease management. We introduce DeepProg, a new computational framework that robustly predicts patient survival subtypes based on multiple types of omic data, using an ensemble of deep-learning and machine-learning models. We apply DeepProg on 32 cancer datasets from TCGA and identified multiple cancer survival subtypes. Patient survival risk-stratification based on DeepProg is significantly better (p-value=7.9e-7 rank sum test) than Similarity Network Fusion based multi-omics data integration in all cancer types. Further comprehensive pan-cancer comparative analysis unveils the genomic signatures common among all the poorest survival subtypes, with genes enriched in extracellular matrix modeling, immune deregulation, and mitosis processes. Furthermore, models built on closely related cancer types using DeepProg are predictive of the subtypes of some other cancers, demonstrating the utility of DeepProg for transfer learning.
Introduction
Cancer subtypes identification, based on molecular signatures, enables tumor classification beyond tumor stage, grade, or tissue of origin 1. Cancer subtypes sharing similar molecular and pathway alterations could be treated with the same drugs 2. One of such subtypes are survival stratified patient subtypes based on prognostic signatures 3, which can assist clinicians in decision making 4. Moreover, the molecular differences associated with patient survival help shed light to understand the mechanism of tumor progression 5.
Most survival-based molecular signatures are based on one single type of omics data 6. Since each omic platform has specific limitations and noises, multi-omics based integrative approach presumably can yield more coherent signatures 7. However, this approach to predict clinical phenotypes are much less explored comparatively, due to the combination of computational and practical challenges. These challenges include platform-specific measurement biases 8, different data distributions which require proper normalizations 9, as well as very limited sample-sizes with multi-omics measurements due to the high cost 10. Among the multi-omics data integration methods, most of them do not model patient survival as the objective, rather the survival differences associated with molecular subtypes are evaluated in a post hoc fashion 11. iCluster, Similarity Network Fusion (SNF) and rMKL-LPP are such examples 12–14. iCluster is of the earliest methods to cluster cancer samples into different molecular subtypes based on multi-omic features, using probabilistic modelling to project the data to a lower embedding 12. rMKL-LPP combines multiple regularized kernels for each omics to transform the data into a lower embedding and then cluster the samples using k-means 14. Similarity Network Fusion (SNF) algorithm is another popular clustering method to integrate different omic features, by first constructing a distinct similarity network for each omic then fusing the networks using an iterative procedure 13. It was applied on multiple TCGA cancer datasets 15,16.
Unlike the methods mentioned above, DeepProg explicitly models patient survival as the objective. It constructs an ensemble of hybrid-models (a combination of deep-learning and machine learning models) and integrate their outputs following the ensemble learning paradigm. We applied DeepProg on RNA-Seq, Methylation, and miRNA data from 32 cancers in The Cancer Genome Atlas (TCGA), with a total of around 10,000 samples. All the models constructed by DeepProg show better predictive performances when compared to SNF method. The gene expression in the worst survival subtype of all cancers shares common signatures involved in biological functions such as mitotic enhancement, extracellular-matrix destabilization, or immune deregulation. Moreover, DeepProg can successfully predict the outcomes for samples from one cancer using the models built upon other cancers. In short, DeepProg is a powerful, generic, machine-learning and deep-learning based method that can be used to predict the survival subtype of an individual patient.
Results
DeepProg Method overview
DeepProg is a general hybrid computational framework to predict patient survival based on one or more omics data types, such as mRNA transcriptomics, DNA methylation and microRNA expression (Figure 1). The first phase of DeepProg is composed of dimension reduction and feature transformation using auto-encoders, a type of deep neural-network. In the default implementation, the auto-encoders have 3 layers, the input layer, the hidden layer (100 nodes), and the output layer. The transformed features are then subject to uni-variate Cox-PH fitting, in order to further select a subset of features linked to survival. Next, using unsupervised clustering approach, DeepProg identifies the optimal number of classes (labels) of survival subpopulations, and use these classes to construct support vector machine (SVM) based machine-learning models, in order to predict a new patient’s survival group. To ensure robustness of the models, DeepProg adopts a boosting approach and builds an ensemble of models. The boosting approach yields more accurate p-values and C-indices with lower variances and leads to faster convergence of the models (Supplementary Table 1). Each of these models is constructed with a random subset (eg. 4/5) of the original dataset and evaluated using the C-index value from the remaining hold-out (eg. 1/5) testing samples.

DeepProg uses the boosting strategy to build several models using a random subset of the dataset. In each model, each omic data matrix is normalized and then transformed using an autoencoder. Each of the new hidden-layer features in autoencoder is then tested for association with survival using uni-variate Cox-PH models. The features significantly associated with survival are then subject to clustering with Gaussian mixture models to identify the optimal number of clusters. Upon determining the optimal cluster, the top features in the each omic input data type are selected through Kruskal-Wallis analysis (default threshold = 0.05). Finally, these top omics features are used to construct a support vector machine (SVM) classifier, and to predict the survival risk group of a new sample. DeepProg combines the outputs of all the classifier models to produce more robust results.
Prognostic prediction on 32 TCGA cancers
We applied DeepProg to analyze the multi-omics data (RNA-Seq, miRNA-Seq and DNA methylation) of 32 cancers in TCGA (Supplementary Table 2). We used only RNA and MIR for Ovarian Cancer (OV) because only a small fraction (9 out of 300) of the samples had the 3-omics data at the time of the manuscript submission. For each cancer type, we selected the optimal clustering number K that produces the best combination of silhouette scores and Adjusted Rand Index (Supplementary Table 3), metrics that measure the clustering stabilities and accuracy. Almost all cancers (30 out of 32) have K=2 as the most optimum survival-subgroups (Figure 2A). With the optimal cluster numbers, we computed the log-rank p-values among the different survival subtypes of each cancer, all of which are statistically significant (log rank p-values < 0.05) and have C-indexes (0.6 -1.0) greater than 0.5, the expected value of random models. Among them, 23 out of 32 cancers have log rank p-values less than 5e-4, highlighting the values of the models at differentiating patient survival (Figure 2B). Additionally, we investigated the average number of hidden-layer features significantly associated with survival, for each omic data type and each cancer (Supplementary Figure 1). Overall, RNA-Seq has the most amount of important hidden features towards survival prediction. miRNA hidden features have similar patterns in all cancers, with fewer total counts. Although vast heterogeneity exists among 32 cancers, some cancers known to be closely related, such as colon cancer (COAD) and gastric cancer (STAD), as well as bladder cancer (BLCA) and kidney cancer (KIRC), also share similar prognostic hidden features.
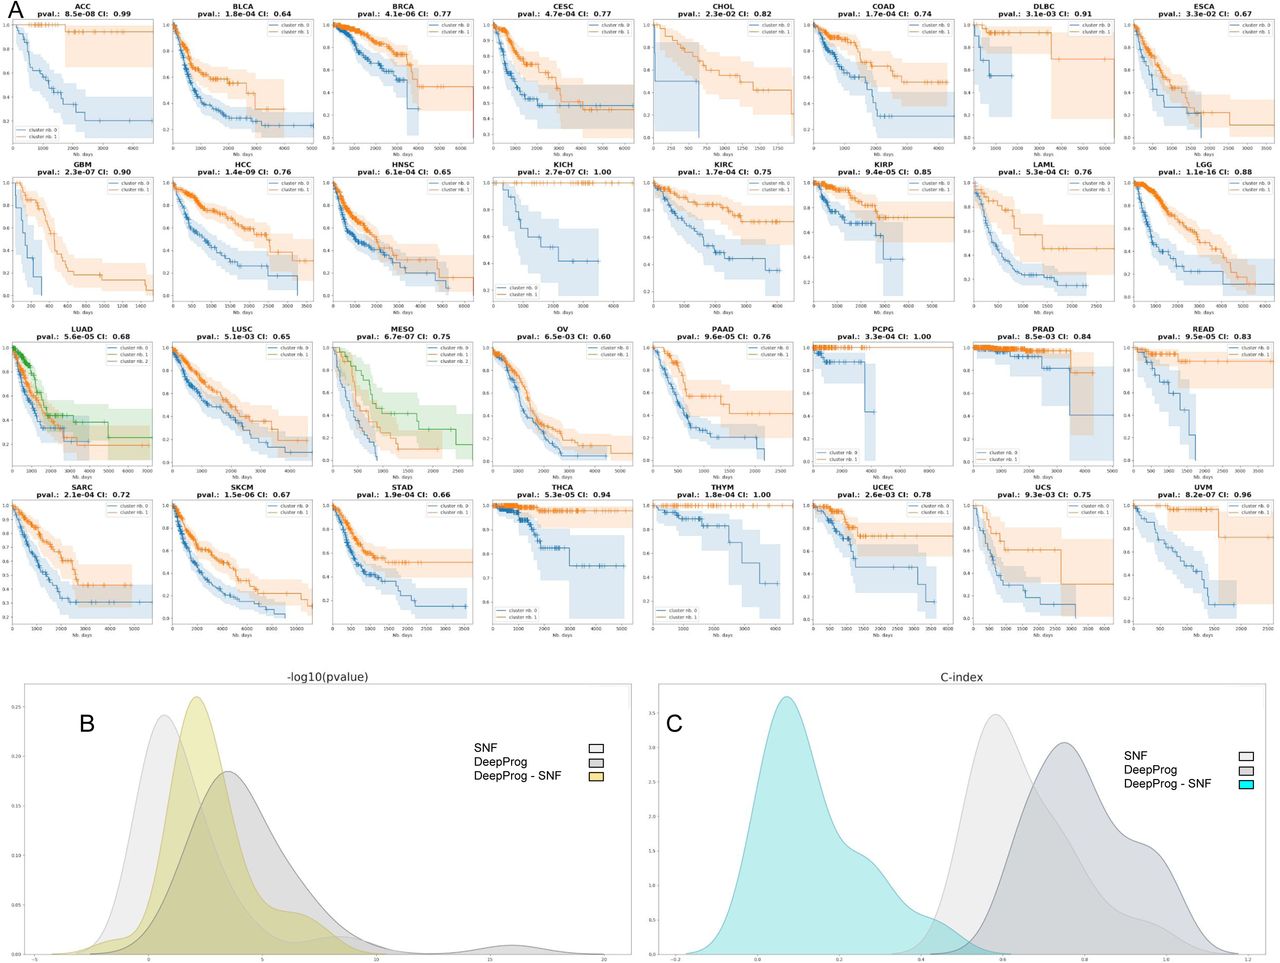
A) Kaplan-Meier plots for each cancer type, where the survival risk group stratification is determined by DeepProg. B) The density distributions of -log10 (log-rank p-value) for the Cox-PH models based on the subtypes determined by DeepProg (light grey line), SNF (dark grey line), or the pair-wise -log10 (log-rank p-value) differences between DeepProg and SNF (blue line). C) Smoothed C-index distributions for the Cox-PH models based on the subtypes determined by DeepProg (light grey line), SNF (dark grey line), or the pair-wise C-index difference between DeepProg and SNF (blue line).
To evaluate the new DeepProg method, we compared the results from the 32 cancers above with those obtained from the Similarity Network Fusion (SNF) algorithm 13, a state-of-the-art method to integrate multi-omics data (Figure 2B and 2C, Supplementary Figure 2). Previously SNF was used to identify cancer subtypes linked to survival by others 15,16. As shown in Figure 2B, the survival subtypes from SNF only have significant survival difference in 13 out of 32 cancers (p-value<0.05). In all, DeepProg yields much better log-rank p-values (Figure 2B) and C-indices (Figure 2C). Additionally, considering that TCGA datasets might have changed since the time of the SNF publication, we also used the patient subtypes identified in the original SNF paper on five test datasets, and used them to obtain log-rank survival subtype p-values 13. These p-values are all less significant, compared to those obtained from DeepProg using the same five datasets as the inputs (Supplementary Table 4).
Validation of DeepProg performance by other cohorts
One key advantage of the DeepProg workflow is its ability to predict the survival subtype of any new individual sample that has some common RNA, miRNA or DNA methylation features with the training dataset (Figure 1B). DeepProg normalizes a new sample by taking the relative rank of the features and use them to compute the distances to the samples in the training set (see Methods). To validate the patient survival risk stratification of DeepProg models, we applied them on additional independent cancer datasets, two from hepatocellular carcinoma (HCC) cohorts (Figure 3A-B) and four from breast cancer (BRCA) cohorts (Figure 3C-F). The two HCC validation sets are LIRI dataset with 230 RNA-Seq samples, and GSE dataset with 221 gene expression array results (see Methods). We obtained a C-index of 0.80 and log-rank p-value of 1.2e-4 (LIRI), and a C-index of 0.73 and log-rank p-value of 1.5e-5 (GSE), respectively (Figure 3A-B). The four BRCA datasets have C-indices of 0.68-0.73, all with significant log-rank p-values (<0.05) for survival difference (Figure 3C-F). We thus validated the predictability of DeepProg by additional HCC and BRCA cohorts.

RNA-Seq Validation datasets for HCC: (A) LIRI (n=230) and (B) GSE (n=221) and validation datasets for BRCA: (C) Patiwan (n=159), (D) Metabric (n=1981), (E) Anna (n=249), and (F) Miller (n=236)
Identification of signature genes for the worst survival subtypes reveals pan-cancer patterns
In order to identify the key features that are associated with patient survival differences, we conducted a comprehensive analysis on features in each omic layer that are significantly over- or under-expressed among the subset of patients with the poorest survival. Next, among the over- or under-expressed features we selected important features from the input data types whose Wilcoxon rank test p-values are less than 1e-4. For each of these features we computed the univariate Cox-PH regression in each cancer type and ranked them based on the -log10 (p-values). Upon normalizing these ranks between 0 and 1, we obtained a pan-cancer rank by summing over all 32 cancer types (see Methods). We describe the results in RNA-Seq analysis in the following and summarize the results on microRNA and DNA methylation analysis in Supplementary File 1.
The RNA-Seq analysis shows some emerging patterns of over-represented genes within the poorest survival group (Figure 4A). CDC20 is ranked first, and some other genes from the cell division cycle (CDC) family, including CDCA8, CDCA5, CDC25C and CDCA2, are also among the top 100 genes (Supplementary Table 5). Additionally, numerous genes from the Kinesin Family Member (KIF) (i.e. KIF4A, KIF2C, KIF23, KIF20A, KIF18A, KIFC1, KIF18B, and KIF14) are present in the top 100 genes (Supplementary Table 5). The CDC genes 17–21 and KIF genes over expression 22,23 have been reported in metastasis process and linked to poor prognosis. Many other genes over-expressed in the poor survival group are concordant with previous studies, such as ITGA5, CALU, PLKA1, KPNA2, APCDDL1, LGALS1, GLT25D1, CKAP4, IGF2BP3 and ANXA5 24. Using the ranking values, we clustered the cancers and the genes and detected two clear gene clusters, enriched with biological functions of cell-cycle and mitosis (Adj. p-value= 3e-42) and Extracellular matrix organization pathway (Adj. p-value=6e-9), respectively (Figure 4A). In addition, the analysis shows two distinct groups of cancers, where GBM, HNSC, OV, STAD, COAD, LUSC, and KIRC are in one group, and cancers such as PRAD, PAAD, and LUAD are in the other group (Figure 4A).

A) Top 100 over- and under-expressed genes for RNA, MIR, and METH omics ranked by survival predictive power. The colors correspond to the ranks of the genes based on their –log10 (log-rank p-value) of uni-variate Cox-PH model. Based on these scores, the 32 cancers and the features are clustered using the WARD method. B) Co-expression network constructed with the top 200 differentially expressed genes from the 32 cancers. The 200 genes are clustered from the network topology with the Louvain algorithm. For each submodule, we identified the most significantly enriched pathway as shown on the figure. C) The expression values of these 200 genes used to construct the co-expression network. A clustering of the cancers using these features with the WARD method is represented in the x axis
Among the genes that are under-expressed in the poorest survival groups, CBX7 and EZH1 are the top 2 genes (Supplementary Table 5). Down-regulation of CBX7 was shown to play a critical role in cancer progression 25. Similarly, EZH1 inhibition was shown to be involved in cell proliferation and carcinogenesis 26,27. Additionally, multiple genes in zinc finger family are downregulated (ZBTB7C, ZMAT1, ZNF18, ZNF540, ZNF589, ZNF554, and ZNF763). ZNF genes are a large family of transcription factor and many of them were shown relevance in cancer progression 28.
RNA-Seq co-expression network analysis
To characterize further the RNA-Seq gene expression associated with the poorest survival subtypes, we performed a global gene co-expression analysis. For each cancer type, we selected differentially expressed genes from the worst survival subtype (Figure 4A) and constructed a pan-cancer consensus co-expression network. As an illustration, we constructed a subgraph of co-expression using the top 200 genes and the most significant edges (Figure 4B), performed gene community detection using random-walks algorithm 29. A large fraction of top co-expressed genes overlaps with the top survival genes highlighted earlier. For example, a tight cluster (group 1) is composed of multiples CDC and KIF genes, together with BUB1, MCM10, AURKB, CENPA, CENPF, and PLK1. These genes are related to mitosis and cell cycle pathway (q-value=2e-28). Two clusters (groups 4 and 5) that include multiple collagens are enriched with extracellular matrix (ECM) organization and receptors function (q-value=2e-16) (Figure 4B). These results follow the conclusions of previous studies highlighting close correlations between ECM genes, notably SPARC and COL1A1, and tumor invasiveness 30. In addition, the network unveiled two major groups of genes associated with immunoregulation between lymphoid and non-lymphoid cell pathway (group 2, q-value=6e-10) and smooth muscle contraction (group 3, q-value=7e-12), respectively. Similar to signature gene results (Figure 4A), gene-cancer cluster map shows very close similarities between COAD and STAD on RNA co-expression (Figure 4C), which was observed earlier in features, and was reported as pan-gastrointestinal cancers from the cancer tissue-of-origin study (Hoadley et al., 2018).
Similar cancer types can be used as predictive models
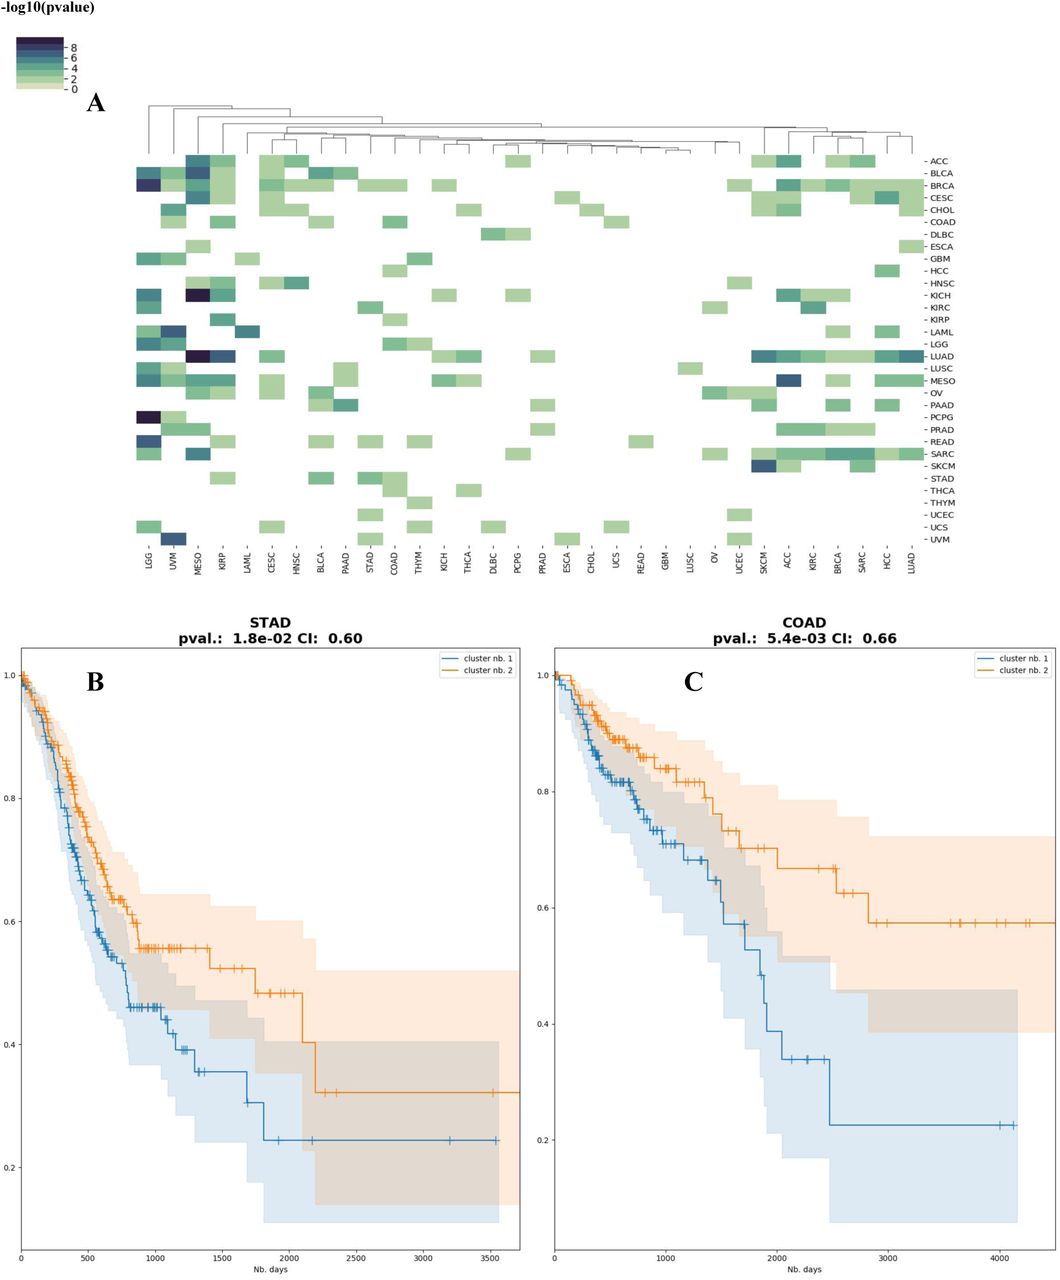
Motivated by the similarities observed among some cancers, we explored if the models are suitable for transfer learning, that is, the model built on one particular cancer type can be used to predict survival of patients in another cancer type. We tested all pairs of 32 cancers, used alternatively as training and test datasets. Many of the cancer models are effective at predicting other cancer types (Figure 5A). Interestingly, models built on mesothelioma (MESO) data significantly predict the subtypes of 13 other cancer types, with long-rank p-values ranging from 0.048 to 4.8e-6, and C-indices ranging from 0.58 to 0.82. In general, cancer types that are biologically more relevant have higher predictive accuracies of cross-cancer predictions, for example, the cancer pair COAD/ STAD, the two close cancer types identified by the earlier signature gene analysis (Figure 4C). The STAD model significantly predicts the subtypes of COAD samples (p-value=0.018, CI=0.60) (Figure 5B), and vice versa for the COAD model prediction on STAD samples (p-value=5.4e-3, CI=0.66) (Figure 5C).
A) Heatmap of the Cox-PH log-rank p-values for the subtypes inferred using each cancer as training dataset. B) Kaplan-Meier plot of predicted subtypes for COAD, using the DeepProg model trained on STAD. C) Kaplan-Meier plot of predicted subtypes for STAD, using the DeepProg model trained on COAD.
Discussion
In this report, we present a novel and generic computational framework, named DeepProg, which processes multiple types of omics data sets with a combination of deep-learning (autoencoder) and machine-learning algorithms, specifically for survival prediction. We have demonstrated several characteristics of DeepProg, including its superior predictive accuracy over the state-of-the-art method SNF, its robustness at predicting other HCC and BRCA population cohorts’ patient survival, as well as its suitability as a transfer learning tool trained from a relevant cancer to predict another cancer.
A few unique mechanistic features of DeepProg contribute to its accuracy. First, it uses boosting procedures that increase the robustness of the final model, by agglomerating weaker models from different subsets of the original samples. This design is well adapted to distributed computing architectures and can be scaled-up easily. Secondly, it employs a modularized design for each omic data type, and can be extended to other omics and data types. DeepProg first processes each omic data set individually with autoencoders, and then merge the hidden layer features under a unified Cox-PH fitting – clustering – supervised classification workflow. The autoencoder structure transforms the initial input features of various omics types into new features. In this study, we demonstrated DeepProg in integrating 3 types of omics data: RNA-Seq, microRNA-Seq and DNA methylation. Due to the characters of different types of data, such as sparsity for mutation data, sequential and spatial organization for image data, other specialized deep-learning models can be developed as individual modules and added to DeepProg. DeepProg, performed significantly better overall than SNF at predicting patient survival. One major reason is that SNF doesn’t model patient survival as the objective, rather, it relies on the patterns from omics solely, to yield insights on phenotypes. Also, as an unsupervised method, SNF lacks the predict the prognosis of a new samples like DeepProg.
We further used DeepProg to identify global signatures of tumor aggressiveness among 32 types of cancers. Although previously several pan-cancer studies used one or different omic types to understand pan-cancer molecular hallmarks 24,31,32, the report here is first of its kind to systematically characterize the differences between survival subtypes in pan-cancer. We identified the top survival features linked to the aggressive subtypes and focused on RNA-Seq expression analysis. The pan-cancer gene regulatory network highlights the top co-expressed genes in the most aggressive subtype of these cancers. Many of them are related to cell proliferation, extracellular matrix (ECM) organization, and immunoregulation, confirming earlier results in literatures on cancer invasion 33,34. Such genes are notably linked to the cell-division cycle 19, cytoskeleton structure 35, collagens 34 or cadherin families 36. We found also several genes linked to smooth muscle contraction. For example, Calponin gene CNN1, TAGLN, and TMP2 are co-expressed in different cancers (Figure 4). Also, CNN1, TAGLN and TMP2 were already characterized as prognostic molecular markers for bladder cancer with higher expression associated with lower survival 37. Interestingly, various transcription factor families, such as Zinc finger genes are down-regulated and HOX genes are hypermethylated (Supplementary Table 5). Such observations are supported by previous reports, as multiple zinc-finger proteins have been shown to act as tumor suppressor genes 38, and dysregulation of HOX genes is frequent in cancer as many of them play important roles in cell differentiation 39. It will be of interest to follow up experimentally to test their effects. Lastly, through comprehensive comparison among 32 cancers, the molecular similarities that are clinically (survival) relevant are revealed. For example, aggressive subgroups from COAD and STAD, two gastroenteric cancers, present multiple common patterns. We speculate that these relationships can be exploited in the future to build more robust analyses 40, and help strategize treatment plans by leveraging patient profiles and cancer similarities.
Methods
TCGA datasets
We obtained the 32 cancer multi-omic datasets from NCBI using TCGA portal (https://tcga-data.nci.nih.gov/tcga/). We used the package TCGA-Assembler (versions 2.0.5) and wrote custom scripts to download RNA-Seq (UNC IlluminaHiSeq RNASeqV2), miRNA Sequencing (BCGSC IlluminaHiSeq, Level 3), and DNA methylation (JHU-USC HumanMethylation450) data from the TCGA website on November 4-14th, 2017. We also obtained the survival information from the portal: https://portal.gdc.cancer.gov/. We used the same preprocessing steps as detailed in our previous study 41. We first downloaded RNA-Seq, miRNA-Seq and methylation data using the functions DownloadRNASeqData, DownloadmiRNASeqData, and DownloadMethylationData from TCGA-Assembler, respectively. Then, we processed the data with the functions ProcessRNASeqData, ProcessmiRNASeqData, and ProcessMethylation450Data. In addition, we processed the methylation data with the function CalculateSingleValueMethylationData. Finally, for each omic data type, we created a gene-by-sample data matrix in the Tabular Separated Value (TSV) format using a custom script.
Validation datasets
For breast cancer data, we use four public breast cancer gene expression microarray datasets and one Metabric RNA-Seq dataset as the validation datasets. Four public datasets (all on Affymetrix HG-U133A microarray platform) were downloaded from Gene Expression Omnibus (GEO). Their accession IDs are GSE4922 42, GSE1456 43, GSE3494 44 and GSE7390 45. Their pre-processing was described in a previous study 46. For the Metabric dataset, we obtained approval from the Synapse repository: https://www.synapse.org/#!Synapse:syn1688369, and used the provided normalized data described in the Breast Cancer Challenge 47. The metabric dataset consists of 1981 breast cancer samples, from which we extracted RNA-Seq data. For hepatocarcinoma datasets, we used two larger datasets: LIRI and GSE datasets, as described in the previous study 41.
DeepProg framework
DeepProg is a semi-supervised hybrid machine-learning framework that takes multiple omics data matrices and survival information as the input. For each sample s, the survival data have two features: the observation time t and the observed event (death) e. The pipeline is composed of the following unsupervised and supervised learning modules (the details of each step is described in the subsequent paragraphs). Module 1: unsupervised subtype inference: each input matrix is processed with: a) normalization, b) transformation using an autoencoder for each omics data type, and c) selection of the survival-associated latent-space features from the bottle neck layer of autoencoders. The selected survival-associated latent-space features from all the omics are then combined for a clustering analysis. Module 2: supervised prediction of a new sample, this module is composed of the following steps: a) construction of a classifier using the training set, b) selection and normalization of the common features with the new sample, c) prediction. For both unsupervised and supervised inferences, we use an ensemble of DeepProg models through boosting approach: each model is constructed with a random subset (80%) of the training dataset. The clustering and the prediction results are combined according to the relevance of each model.
Normalization
We first select the top 100 features from the training set that have the highest variance. Then for each sample, we inversely rank the features and divide them by 100, so that the score is normalized between 0 and 1. Next we compute the sample-sample Pearson correlation matrix of size n, the number of samples. For each sample, we use the sample-sample distances as new features and normalize it using the rank as well. As a result, each sample has n features with the score of the first feature equal to 1.0 and the last feature equal to 0.
To a normalize a new sample (in the model prediction stage), we first select the set of common features between the new sample and the training set. We then perform the same steps as described above: a) selection of top 100 features, b) rank-based normalization, c) distance computation with the samples from the training set, and d) rank normalization.
Autoencoder transformation
An autoencoder is a function f(v) = v′’ that reconstructs the original input vector v composed of m features through multiple nonlinear transformations (size(v) = size(v′) = m). For each omic data type, we create one autoencoder with one hidden layer of size h (default 100) that corresponds to the following equation:

W’, W are two weight matrices of size h by m and m by h, and b, b’ are two bias vectors of size h and h’. tanh is a nonlinear, element-wise activation function defined as

To train our autoencoders, we search the optimal W*, W’*, b* and b’* that minimizes the log-loss function.
We use python (2.7) Keras package (1.2.2) with theano as tensor library, to build our autoencoders. We use the Adam optimization algorithm to identify W*, W’*, b* and b’*. We train our autoencoder on 10 epochs and introduce 50% of dropout (i.e. 50% of the coefficients from W and W’ will be randomly set to 0) at each training iteration.
Selection of new hidden-layer features linked to survival
For each of the transformed feature in the hidden layer, we build an univariate Cox-PH model using the R package survival 48 and identify those with log-rank p-values (Wilcoxon test) < 0.01. We then extract all the significant new latent features from all autoencoders and combine them as a new matrix Z.
Cancer subtype detection
We perform a gaussian mixture model-based clustering on matrix Z to identity patient clusters (subtypes) in each cancer. For this we use the GaussianMixture function from the scikit-learn package with 1000 iterations, 100 initiations and a diagonal covariance matrix. The resulting clusters are sorted according to their median survival levels: the cluster labelled as “0” has the overall lowest median survival, while the last cluster “N” has the highest survival overall.
Construction of supervised classifiers to predict the cancer subtype in new samples
We use the cluster labels obtained from the above Gaussian mixture model to build several supervised machine learning models that can classify any new sample, under the condition that they have at least a subset of features in common with those input features from the training set. First, we compute a Kruskal-Wallis test for each omic type and each feature, in order to detect the most discriminative features with respect to the cluster labels. Then we select the 50 most discriminative features for each omic type and combine them to form a new training matrix M. We apply Support Vector Machine (SVM) algorithm to construct a predictive model using M as the input and the cluster labels as classes. To find the best hyper-parameters of the classifier, we perform a grid-search using a 5-fold cross-validation on M, with the objective to minimize the errors of the test fold. The algorithm constructs at first a classifier using all the omic types from the training samples. If a new sample shares only a subset of omics data types and a subset of the features with the training samples (eg. a sample has only RNA-Seq measurement), then DeepProg constructs a classifier using only this subset of omics data type and features, before applying it to the new sample. We use the python sklearn package to construct SVM models and infer the class probability with the predict_proba function, by fitting a logistic regression model on the SVM scores 49.
Boosting procedure to enhance the robustness of DeepProg
To obtain a more robust model, we aggregate multiple DeepProg models constructed on a random subset of the training samples. As the default, we use 10 models with 80% of original training samples to construct all the cancer models, expect for LUSC and PRAD which we use 20 models since they are more difficult to train. The aggregation of these models (per cancer) works as the follow: after fitting, we eliminate those models without any new features linked to survival or having no cluster labels significantly associated with survival (log-rank p-value > 0.05). For a given sample, the probability of belonging to a particular cancer subtype is the average of the probabilities given by all the remaining models. We use the class probability of the worst survival subtype to assign the final label. Based on the initial number of clusters K, we define threshold values such as thres1=0.50 for N=2, thres1=0.33, thres2=0.66 for N=3 and so on. The final label l of a new sample depends on which interval its class probability p falls within: l=0 if p < thres1, l=1 if thres1 <= p < thres2, etc.
Choosing the correct input number of clusters and performance metrics
When fitting a model, DeepProg computes several quality metrics: the log-rank p-value for a Cox-PH model using the cluster labels as described above, the concordance index (C-index) 50, and the Silhouette score measuring the clusters homogeneity. In addition, DeepProg measures the clustering stability, that is, the consistence of class labeling among the difference models during boosting. We compute the clustering as the following: a) For each pair of models, we compute the adjusted Rand Index between the two set of cluster labels (ARI) 51, b) we then calculate the mean of all the pair-wise rand indexes. For each cancer models we test different initial number of clusters (K=2,3,4,5). We then select the K presenting the best overall results based on silhouette score. Furthermore, we also select carefully the K that minimizes the crossovers on the Kaplan-Meier (KM) plots, when plotting the stratified patient survival groups according to the cluster labels.
Identification of the differentially expressed features amongst the 32 cancers
To identify the input omics features differentially expressed between the worst survival subtype and other(s), we perform two-group (worst survival subgroup and the other remaining samples) Wilcoxon rank-sum test for each feature, using the Scipy.stats package. We then select features significantly over- or under-expressed with p-values<0.001. Next, we rank the differentially expressed features among the 32 cancers. For this purpose, we construct a Cox-PH model for each cancer and each significant feature and rank the features according to their -log10 (log-rank p-value). We then normalize the ranks among these significant features between 0 and 1, where 1 is attributed to the feature with the lowest Cox-PH log-rank p-value and 0 is assigned to the feature with the highest Cox-PH log-rank p-value in the set. We then sum the ranks of each feature among the 32 cancers to obtain its final score.
Construction of the co-expression network
For each cancer, we first identify (at most) the top 1000 RNA-Seq genes enriched in the worst subtype according to their Wilcoxon rank test p-value. We then use these genes to construct a Gene Regulatory Network. For each pair of genes (nodes), we obtain an interaction score based on their correlation, and assign it to the edge between them. For each network, we normalize the scores by dividing them with the maximal value. We then score each gene with the sum of its edge scores. We combine the network obtained for the 32 cancers into a global pan-cancer co-expression network, using the GRNBoost2 algorithm from the python package arboreto. Specifically, we use the following steps: a) aggregating the nodes, node weights, edges, and edge weights of each cancer network into a consensus graph, b) selecting the top 200 genes and construct its corresponding subgraph, c) performing edge pruning on each gene by removing all but the top 10 edges, according to their weights, and d)applying a community detection algorithm on the graph using the random-walk algorithm from the python library igraph, and visualizing the graph using Gephi 52.
Data Availability
Data are available upon request
Supplementary materials
Supplementary File 1: Additional analysis of microRNA and methylation signatures between the worst survival subtype vs. the remaining samples in each cancer.
Supplementary Figure 1 Average number of autoencoder hidden-layer features significantly associated with survival for each omic data type and cancer type.
Supplementary Figure 2 Kaplan-Meier plots for each cancer type, where the survival risk group stratification is determined by SNF, with the same datasets used from the DeepProg analysis in Figure 2A.
Supplementary Table 1 DeepProg performances when using number of models ranging from 1 to 30. The Cox-PH log-rank p-value (pval) and the C-index (CI) are calculated for two datasets: HCC and BRCA. Two validation datasets are used for HCC: LIRI and GSE, and four datasets for BRCA, named Anna, Patiwan, Miller, and Metabric datasets respectively.
Supplementary Table 2 Summary of 32 TCGA cancer types
Supplementary Table 3 Cox-PH log-rank p-value, Silhouette score, and clustering stability score obtained using DeepProg on the 32 cancers and with a number of input clusters from 2 to 5
Supplementary Table 4 Comparison of DeepProg results using the same benchmark datasets as those obtained from the original SNF paper.
Supplementary Table 5 Top 100 features significantly linked to the lowest survival subtypes among the 32 cancers and ranked using their individual Cox-PH p-value in the different datasets. The features are separated among RNA, MIR and METH features, by over- and under-expressed features.
Author Contributions
LG envisioned this project. OP developed DeepProg algorithm, implemented the project and conducted the analyses, OP and LG wrote the manuscript. SH and KC helped to download and process the datasets. All authors have read and agreed on the manuscript.
Competing financial interests
The authors declare no competing financial interests.
Acknowledgements
This research was supported by grants K01ES025434 awarded by NIEHS through funds provided by the trans-NIH Big Data to Knowledge (BD2K) initiative (www.bd2k.nih.gov), P20 COBRE GM103457 awarded by NIH/NIGMS, R01 LM012373 and R01 LM012907 awarded by NLM, and R01 HD084633 awarded by NICHD to L.X. Garmire.
References


